
Issue 10 - Act on metrics
orchestrator-less


I recently noted smart definitions of what are measures, metrics, and KPIs.
👉 Measures are anything that can be measured. Meaning that a measure is not necessarily helping you to figure out if you are doing good or bad.
👉 Metrics are quantifiable measures or a combination of measures that are used to track and assess the status of a process. It’s tactical.
👉 KPIs are metrics you - as a company, as a decision-maker - are willing to focus all your efforts on. It’s strategic.
It’s quite easy to define measures, metrics, or KPIs. But it’s hard to choose the good ones.
We tend to get what we measure, so we should measure what we want.
This is hard. Like really. We want to predict the weather but it’s hard to measure how much a cloud is moving, how big it is, how it moves and evolves in the sky with billions of variables.
We focus on working long hours instead of getting meaningful work done. We care more about getting a thousand steps than we do about being healthy. We teach for standardized tests instead of emphasizing learning, curiosity, and critical thinking.
We often optimize for what we measure. Sometimes not for what is strategic.
We want to stop a pandemic, but it’s damn hard to measure how many people are positive, where they are, how new mutations come, find a vaccine, etc... So we act as we can. Taking and explaining decisions that change the lives of millions by defining and looking at metrics.
This quantitative mindset, despite its nerdy aura, is in fact the morally enlightened one, because it treats every human life as having equal value rather than privileging the people who are closest to us or most photogenic.
It holds out the hope that we might identify the causes of suffering and thereby know which measures are most likely to reduce it.
Models are models and we often take shortcuts to measure something we can’t really measure. A proxy. We must be careful with those shortcuts. Systems are often more complex than they seem. If we chose the wrong measurement, we get the wrong behavior.
📡 Expected Contents
Real-time map
On some mornings, I’m taking the bus to go to work. While I live just a few meters from the bus stop, I’m often right on the time to catch the bus.
I would really love to be alarmed when the bus is just 500 meters down the street to be able to perfectly sync with its arrival...
👉 The MTA Live Subway Map is a real-time digital map designed to help riders navigate New York City’s ever-evolving transportation network.
Using the latest data, the map continually reroutes itself to show subway service right now, tonight, and this weekend. It also shares live train movement and times, entrance and exit locations, and tunnels for easy transfers.
As city riders1, we have more and more reliable tools to find our ways in transportation networks. Still, there is a place for improvements.
Looking forward to more local and precise maps or live information 👀

Headless BI
Business intelligence needs a revamp.
Recently we see a big move towards the “headless” thing. BI doesn’t escape the trend. Analytics is expanding into new forms – into spreadsheet-like financial planning software, drag-and-drop product analytics tools, notebooks for exploratory data analysis, and reverse ETL tools.
Because most traditional BI tools have their own ways to define metrics, the same definitions end up duplicated in multiple places, creating inconsistency and extra work for data teams.
👉 Headless BI is an API-first, developer-centric approach to BI that unifies business logic and serves consistent metrics that teams can query anytime, from anywhere. For data analysts, it provides a simple workflow for developing, testing, and publishing metric definitions. For decision-makers, it delivers source-of-truth metrics for querying and visualization in the tools of their choice.
There are already companies like Supergrain who understand the need, but it’s perfectly something we can do in-house2.

Data deleted from production
Do you ever deleted data from production or done something really costly for your company?
I did. Several times.
A Big Query query that costs more than 200€ for one minute of processing (bad filtering). Letting a VM running for several days without any use: 5000€ (a quite big machine). Removing credentials from production. Doing a too quick rm -rf * 👀...
I’m not the only one in the situation, as Christophe wrote recently.
By the way, I really encourage you to subscribe to Christophe’s data newsletter: it’s all about data engineering and it’s overflowing with great resources.
Definitely a diamond 💎
How to name table and fields in a database? Use singular or plural ?
In previous experiences, I work with both singular and plural names. Not a big deal, but it can make things much easier when choosing a consistent naming.
It seems that singular is better than plural, for several reasons :
👉 Convenience. It’s easier to come out with singular names, than with plural ones. Objects can have irregular plurals or not plural at all, but will always have a singular one (with few exceptions like News). Customer, Order, User, Status, etc...
👉 Aesthetic & order. Especially in master-detail scenarios, this reads better, aligns better by name, and have more logical order (master first, detail second):
OrderOrderDetail
Compared to:
OrderDetailsOrders
👉 Simplicity. Put all together, table names, primary keys, relationships, entity classes... is better to be aware of only one name (singular) instead of two (singular class, plural table, singular field, singular-plural master-detail...)
👉 Globalization. You may have a team of different nationalities, not everybody has English as a native language. It would be easier for a non-native English language programmer to think of "Repository" than of "Repositories", or "Status" instead of "Statuses". Having singular names can lead to fewer errors caused by typos, save time by not having to think "is it Child or Children?", hence improving productivity.
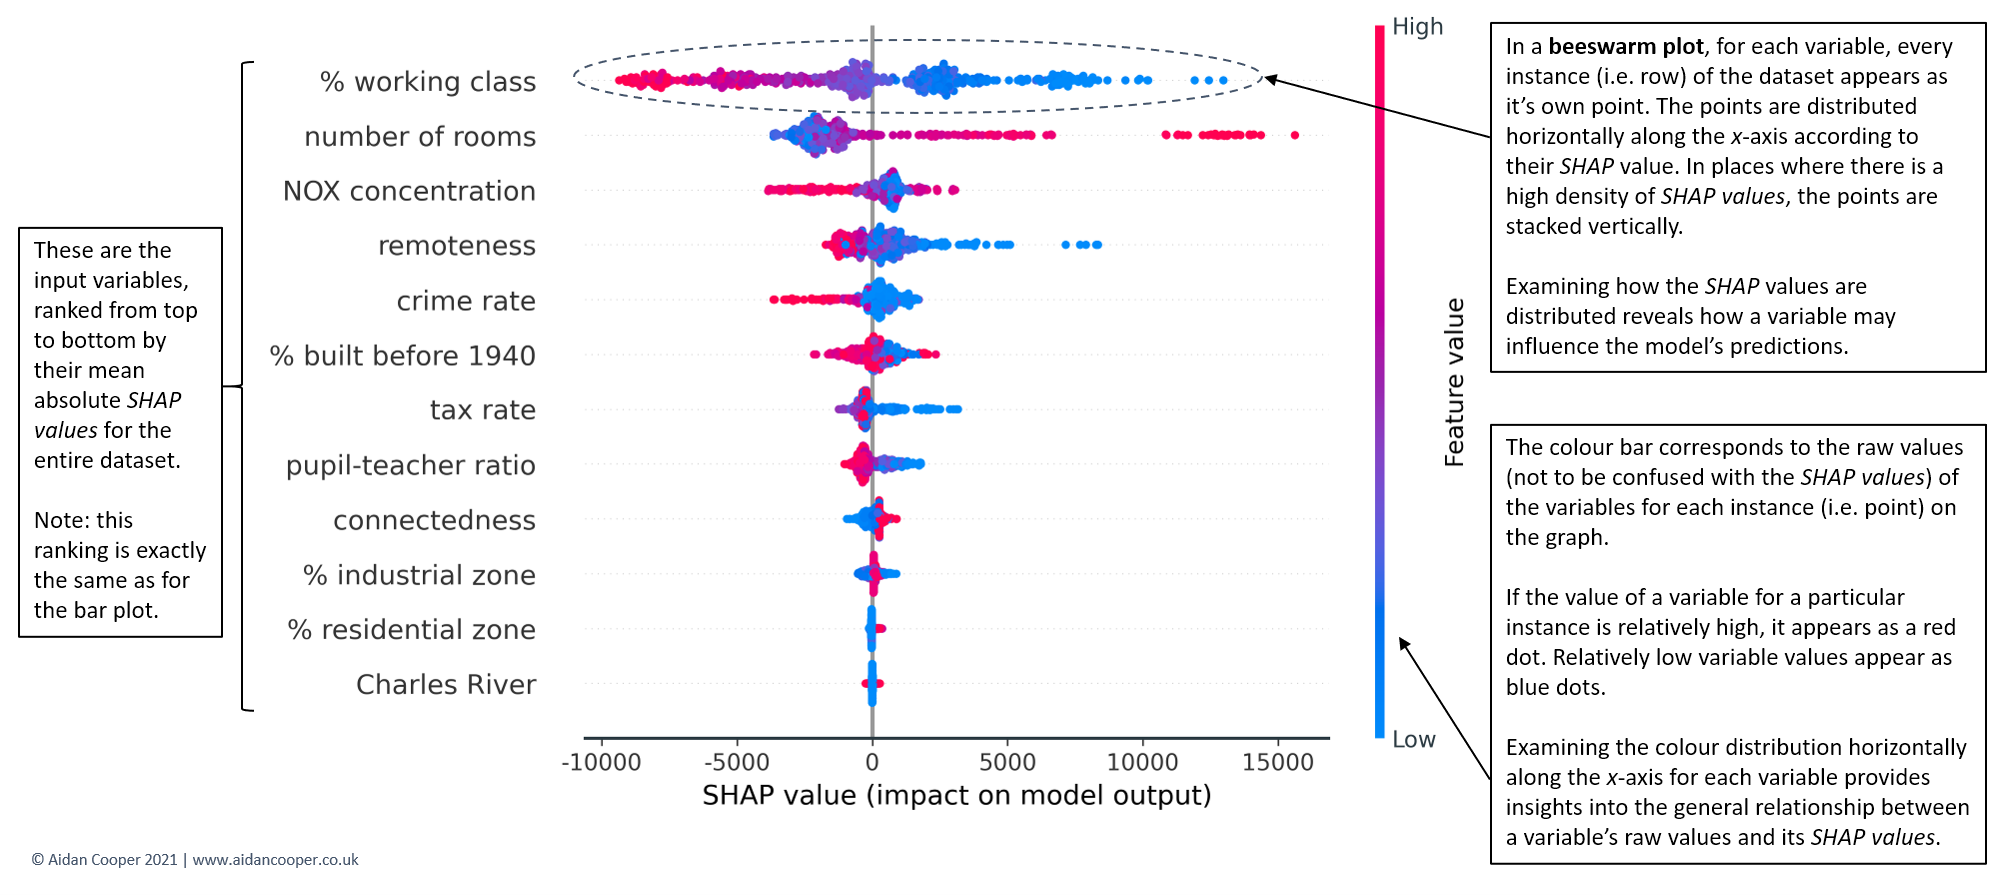
Explaining SHAP values
With interpretability becoming an increasingly important requirement for machine learning projects, there's a growing need for the complex outputs of techniques such as SHAP to be communicated to non-technical stakeholders.
SHAP quantifies how important each input variable is to a model for making predictions. The SHAP library is becoming a basic in the data science toolbox, but it’s often too complicated to explain its outputs to non-technical people.
Here is probably my first favorite data science post of the year. Such a great read!

📰 The Blog Post
Not a blog post this time but a Twitter thread I shared some weeks ago 🧵.
It’s about orchestration, dbt, Airflow, cloud, serverless… all those new buzzwords you know :)


🎨 Beyond The Bracket

For over 70 years, the IKEA catalog was produced in Älmhult, constantly growing in number, scope, and distribution. From the 1950s when Ingvar Kamprad wrote most of the texts himself, via the poppy, somewhat radical 1970s and all the way into the scaled-down 2000s – the IKEA catalog always captured the spirit of the time.
👉 After putting up some IKEA products the last month, I lose myself on the Internet to find their digital museum page.

Beyond this really good concept3, and the change in style between each decade - catching the spirit of the time - catalogs show how IKEA is consistent since its creation.
The overall design, the quality: just by watching the catalog you can feel how thoughtful is the brand and so the product.
Today, IKEA’s furniture is everywhere. Their products are consistent and so are our homes.
I like the feel, the color, and the photography in these catalogs. But what impresses me the most is the consistency in the work, in the product, in the catalog, in the brand.
It’s probably a key in IKEA's success story. A key in any craft?
Being consistent with our patience, our learning, our evolution, our making, our documentation, our vision.


New year, new hopes, new visions.
I often feel a bit weird about the new year. We just did a full turn around the sun but in our brain (at least mine) it’s like we can erase the slate and start with a new blank page. Full of ambition and dreams.
To everyone reading those lines, I hope this regular time trick will give you faith and ambition for the next 365 days.
Thank you for reading this newsletter.
Happy A.D. 20224 everyone 🎉
It’s another story in the countryside.
Without too much thinking, I think a dbt model with correct tests and documentation can be an MVP. Moving to more layering later in the next iterations (API, proper browsing, etc...).
In a digital world, we should focus more on educational stuff and keep the concept of museums, the digital ones.
Or X millionth full turn around the sun.