
Issue 11 - There is no boundary
Football Analytics. The What.

« by alyson provax (+)
”")
Everything is connected to everything else.
There is no clearly determinable boundary between the sea and the land, between sociology and anthropology, between an automobile's exhaust and your nose.
There are only boundaries of word, thought, perception, and social agreement - artificial, mental-model boundaries.
Here is a quote from Thinking in System by Donella H. Meadows which develop how bounded we can be:
Bounded rationality means that people make quite reasonable decisions based on the information they have. But they don't have perfect informations, especially about more distant parts of the system. Fishermen don't know how many fish there are, much less how many fish will be caught by other fishermen that same day.
Businessmen don't know for sure what other businessmen are planning to invest, or what consumers will be willing to buy, or how their products will compete. They don't know their current market share, and they don't know the size of the market. Their information about these things is incomplete and delayed, and their own responses are delayed. So they systematically under- and overinvest.
We are not omniscient, rational optimizers, we are blundering "satisficers" attempting to meet (satisfy) our needs well enough (suffciently) before moving on to the next decision. [...] So instead of finding a long-term optimum, we discover within our limited purview a choice we can live with for now, and we stick to it, changing our behavior only when forced to.
It's a great art to remember that boundaries are of our own making and that they can and should be reconsidered for each new discussion, problem, or purpose.
It's a challenge to stay creative enough to drop the boundaries that worked for the last problem and to find the most appropriate set of boundaries for the next question.
It's also a necessity if problems are to be solved well.
Data are just a delayed version of a passed reality. Still, that’s the best tool we have to understand our own reality. Allowing us to develop our knowledge and expand our boundaries.
📡 Expected Contents
BigQuery under the hood
I’m a big fan of Google Cloud data warehouse: Big Query. It’s fast, reliable and not that much expensive.
However, I never took the time to understand the difference with an on-premise solution, for example, Hive (HDFS/Hadoop).
Google Cloud team wrote an article back in 2016, explaining what’s behind BigQuery - the execution engine, the distributed storage, the compute, and the network.

Moving past Airflow: Why Dagster is the next-generation data orchestrator
This headline is a bit provocative: Airflow is still the leader in the orchestration tool race. Still, other open-source tools offer other designs or visions to handle data pipeline management.
The team behind Dagster1 wrote a great post on their approach to orchestration and the differences between Airflow and Dagster.
An End-to-End Guide to Photogrammetry with Mobile Devices
Photogrammetry is a digital technique to build 3D models out of images. Basically, you take several images of the same place with different angles and software applies some perspective geometry and optic magics.
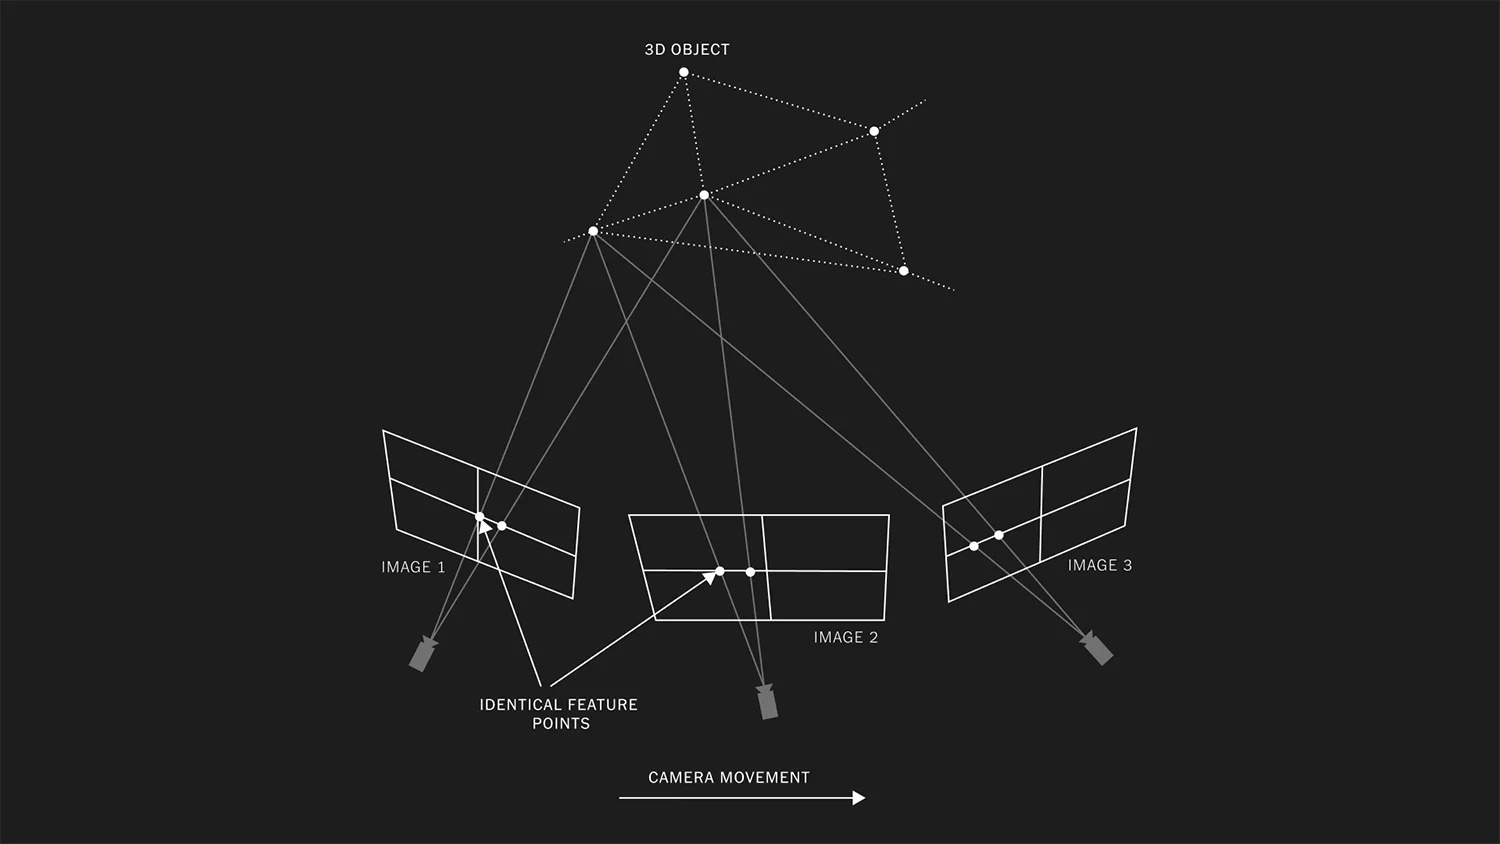
The R&D team at The New York Times write a three-series blogpost about their works on photogrammetry. They explain how to capture images for photogrammetry with a mobile phone, how to process those images to create 3D scenes, and finally how to optimize those models to the web to deliver immersive stories right to our browsers.
That’s another great resource from The New York Times. It’s always so impressive to see the work that is done there.
Definitely worth the look! (📌 the main NYT R&D page)

Hypermodern Python
I often wonder how to introduce Python to newcomers or how to explain the tooling around the language: setup, testing, linting, typing, documentation, and CI/CD.
A guy from my team at work shared this great Python setup guide with a focus on simplicity and minimalism. I bookmarked it and come back to it regularly. I encourage you to do the same, whatever your Python level.
TLDRAW
Do you have a hard time making diagrams?
I personally love the draw.io web application. It’s easy to create well-crafted schemas without the need to learn a lot about the tool. It gathers such lovely features like GCP icons, different fonts, you can connect to GitHub or any “drive” and you can export your graphics in different formats.
Here is an example of a chart I did with draw.io. You can upload the XML file in my GitHub repository to draw.io to see how I built it or even edit it :)

Still, you could prefer something even simpler. That’s where TLDRAW can be useful.
This editor lets you build simple - drawing-like - schemas. I tried it recently and it’s easy to use, smooth to edit and the “draw” style is well rendered.
A good alternative to create schemas for your documentation or slide presentations.

📰 The Blog Post
Part 1 — A Career in Football Analytics, The What
As expected some time ago, I started to write about my journey in the football analytics world.
Here is part one of a three-series blog post, explaining what's football analytics. I hope you’ll enjoy it.
🎨 Beyond The Bracket
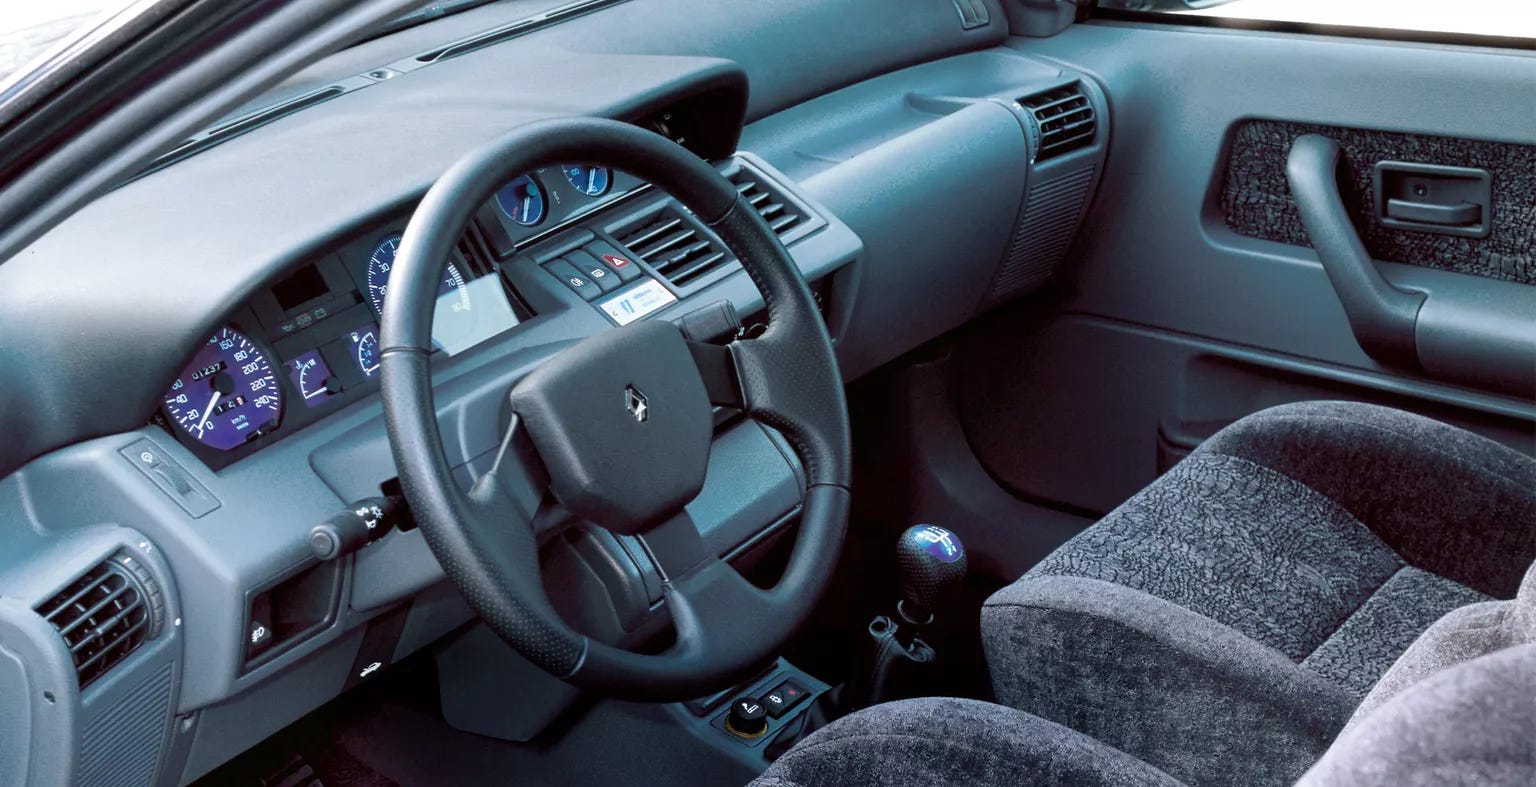
Following Ikea’s digital museum, I discovered The Originals Museum by Renault.
It traces back the iconic Renault cars from the first Type A to the 2006 winning Formula one led by Fernando Alonso.
It’s another scrollytelling piece, well-formatted and optimized for the web.
I love this digital museum format. It’s entertaining, colorful, and fast to explore. A cool feature: they recorded cars sounds (engine, horn, doors, etc...) 🔉.


Again, this kind of website is hard to produce. It involves designers, web developers, storytellers, and UX designers. But the result, in the end, is in my opinion so great that it’s worth the work.
Even if it will not drive sales, it shows the passion and the willingness to share a vision of a company - behind the product itself.
It’s not pure marketing. It’s about feeling, souvenirs, and design.
Do you have any other website like this? I would love to see more like this 🤩.
There were a lot of things in my head those last weeks - feeling like I’m digesting new insights and visions from the last four months. Love that feeling2!
So I’m going to Annecy for some well-deserved holidays and then to the Alps for some skiing ⛷ ⛰️.
The next coming months might be full of projects, I'm sure that thinking while on the chair lift and then and getting down the slopes quickly will be a good fresher to continue going ahead!
Hope you will get some cold fresh air too, see you 🙃
The leader behind Dagster is a former Facebook employee.
It's something I'm really used to now: I feel sometimes overwhelmed - learning a lot of things, discovering new joys of life, developing new visions, etc… but waiting some months and my brain seems to digest all of these stimuli and moves toward new ideas and sources of happiness. I know now that's my lifecycle.