A short while ago I scrolled out Twitter and find this tweet:


Those results1 are quite impressive looking at the scale involved. Beyond the number, this kind of study reminds us how we still haven’t really taken it seriously that when we push buttons on our phone, things happen in the real world.
A US presidency, Covid pass, massive cultural influence, seven days on seven - real-time - information to almost everyone2, etc...
The digital era is still is at its beginning. We probably don’t realize the inertia and the amount of scale involved.
I know several digital workers wondering about the meaning of their jobs. There is an easy argument to say that these jobs are not here, invented out of nowhere.
Still, companies don’t spend high salaries just to say there are trendy on social networks, doing AI or some advanced tech. They pay salaries because the work behind is valuable.
Every digital worker impacts the world on a whole different scale than a baker or a doctor. The digital era moved the work industry from a one-to-one relation to a one-to-many.
That’s an element of why we - digital workers in any domain - are much more paid than society’s elemental jobs3 (think about carbage collectors, policemen, nurses) and even sale jobs.
One-to-many relations upscale systems. Upscaling moves toward higher value.
📡 Expected Contents
Google Cloud architecture diagramming tool
As I said in the previous issue, I love diagrams. It’s so useful to present any project design or code architecture.
When working with cloud products, it’s convenient to use cloud provider service icons. More than the actual graphic it allows people to quickly understand what’s going on.
There were already good tools for AWS charting, like Cloudcraft. Now it’s also true for Google Cloud Platform as Google released their own architecture diagramming tool.
I’ll probably write a blog post on how to create good diagrams. I'll keep you posted!
Docker Best Practices
After the great links on modern Python setup. Here is one on Docker's best practices.
Docker has a quite good learning curve. I personally wrote some wrappers to quickly set up any working environment I need: 🐳 Operation.
The post goes around how to write proper Dockerfile, optimize Docker images, and some memory and logging routines.
The Metagame of Applying Machine Learning
Doing machine learning is hard. Really hard.
It’s probably not the first thing you want to do when facing a data problem.
Still, if you start from problem-solving (not focus on the tech), focus on system and training data design (not model design), clear objectives and measurements, experiment a lot, and keep your conscience clean: you can play that ML game.
Eugene Yan wrote a great article on this - really worth the read before diving into any ML project. I’ll keep it on my closed bookmarks each time I start doing ML.
Solar System in Action
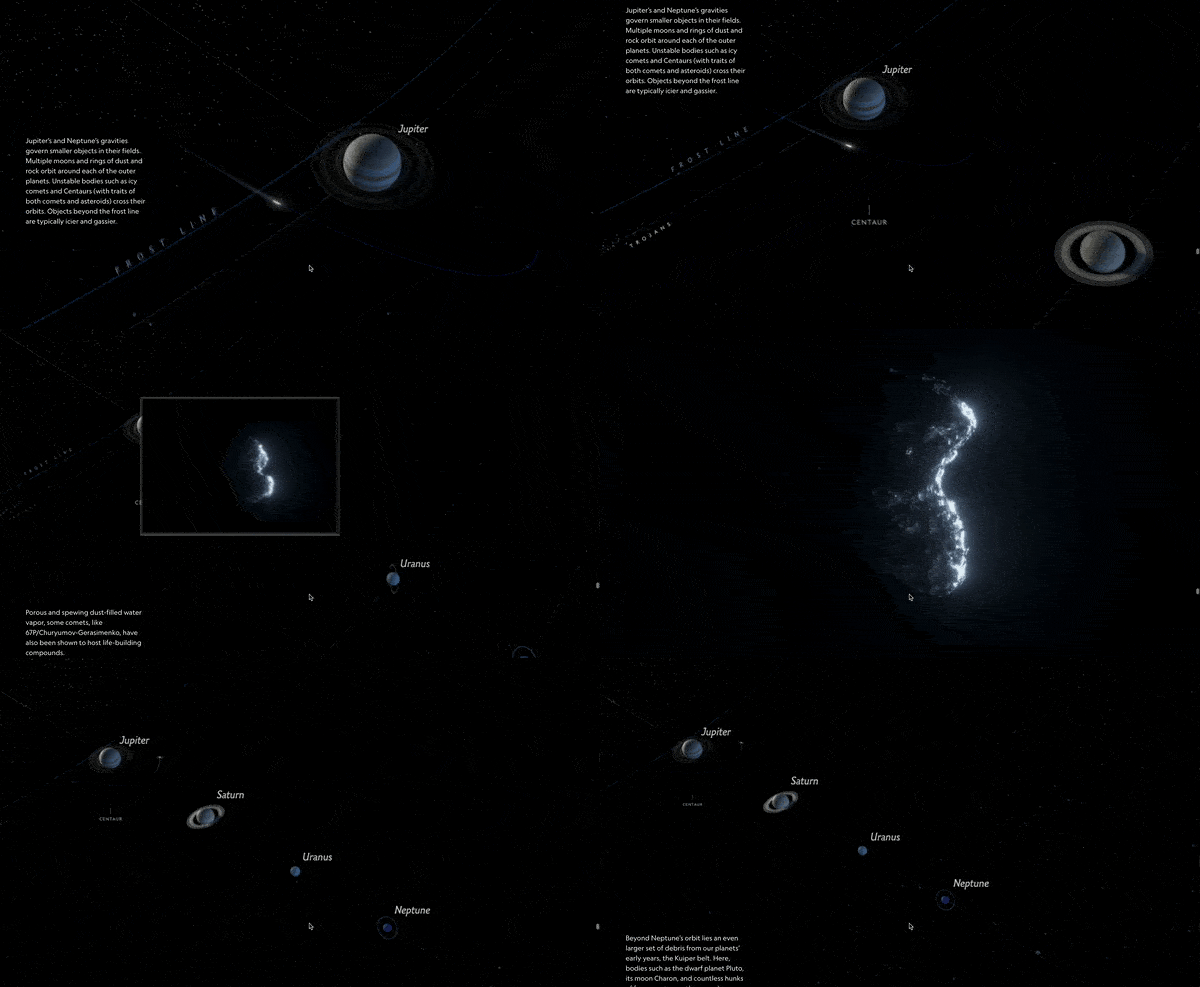
Fans of storytelling, here is a huge work from the National Geographic team!
They came across how tumbling leftover rubble reveals the chaotic birth of our solar system feature.
Not a long read, but very satisfying and inspiring!
When to use quantitative and when to use qualitative color scales
Last week I made some plots at work and I got a hard time choosing a good color scale. I looked back to old bookmarks on the subject and came across this wonderful article from Data Wrapper.
How to use hue, shades, distinguish categories, etc... It shows well what’s working best and what’s not.
A good reminder!
📌 It’s part of bigger series of posts regarding which color scale to use when visualizing data.
📰 The Blog Post
Part 2 — A Career in Football Analytics, The How
Here is part two of a three-series blog post, explaining this time how to enter the football analytics world.
🖇️ If you didn’t read part one: Part 1 - A Career in Football Analytics, The What
🎨 Beyond The Bracket
Working on engineering stuff often requires blending different domains. We often use one piece of knowledge in a different way than the one that was initially intended for it. Creating a whole new element driving use to the wanted solution.
In Japanese art, the idea to derive or parody elements to create a piece of art is called “mitate”.
I recently found out the work of Tatsuya Tanaka. In 2011 he began creating a calendar made of miniatures - the use of alternative items to recreate everyday things in miniature form.
This work is incredible in detail and references. As the author says it “adds a little enjoyment to your everyday life”.
Work like those allows us to challenge how solutions to current issues can be yielded from examining prior systems from novel perspectives.
It comforts me in my approach to making my projects as refined as possible (without being too perfectionist) and to be the first fan of my own work.
Find entertainment in the process. Enjoy learning. Seek growth.
Back to work after some holidays. The last time I went skiing a pandemic was starting, now a war. I will probably go elsewhere next time...
Beyond the joke, what’s happening with Russia is serious and worrying. One-to-many relations are sometimes dangerous. One guy is endangering millions of people. Out of nothing.
As Benn Stencil summed it up: nothing to add.
Hope for peace soon. Live in the moment. Be safe.
Looking closer to the paper it seems like serious research.
It doesn’t excuse that those elemental jobs are underestimated and underpaid…


