
Issue 7 - Life in a nonlinear world
Analytics on the pitch

A few months ago I was speechless looking at those maps.
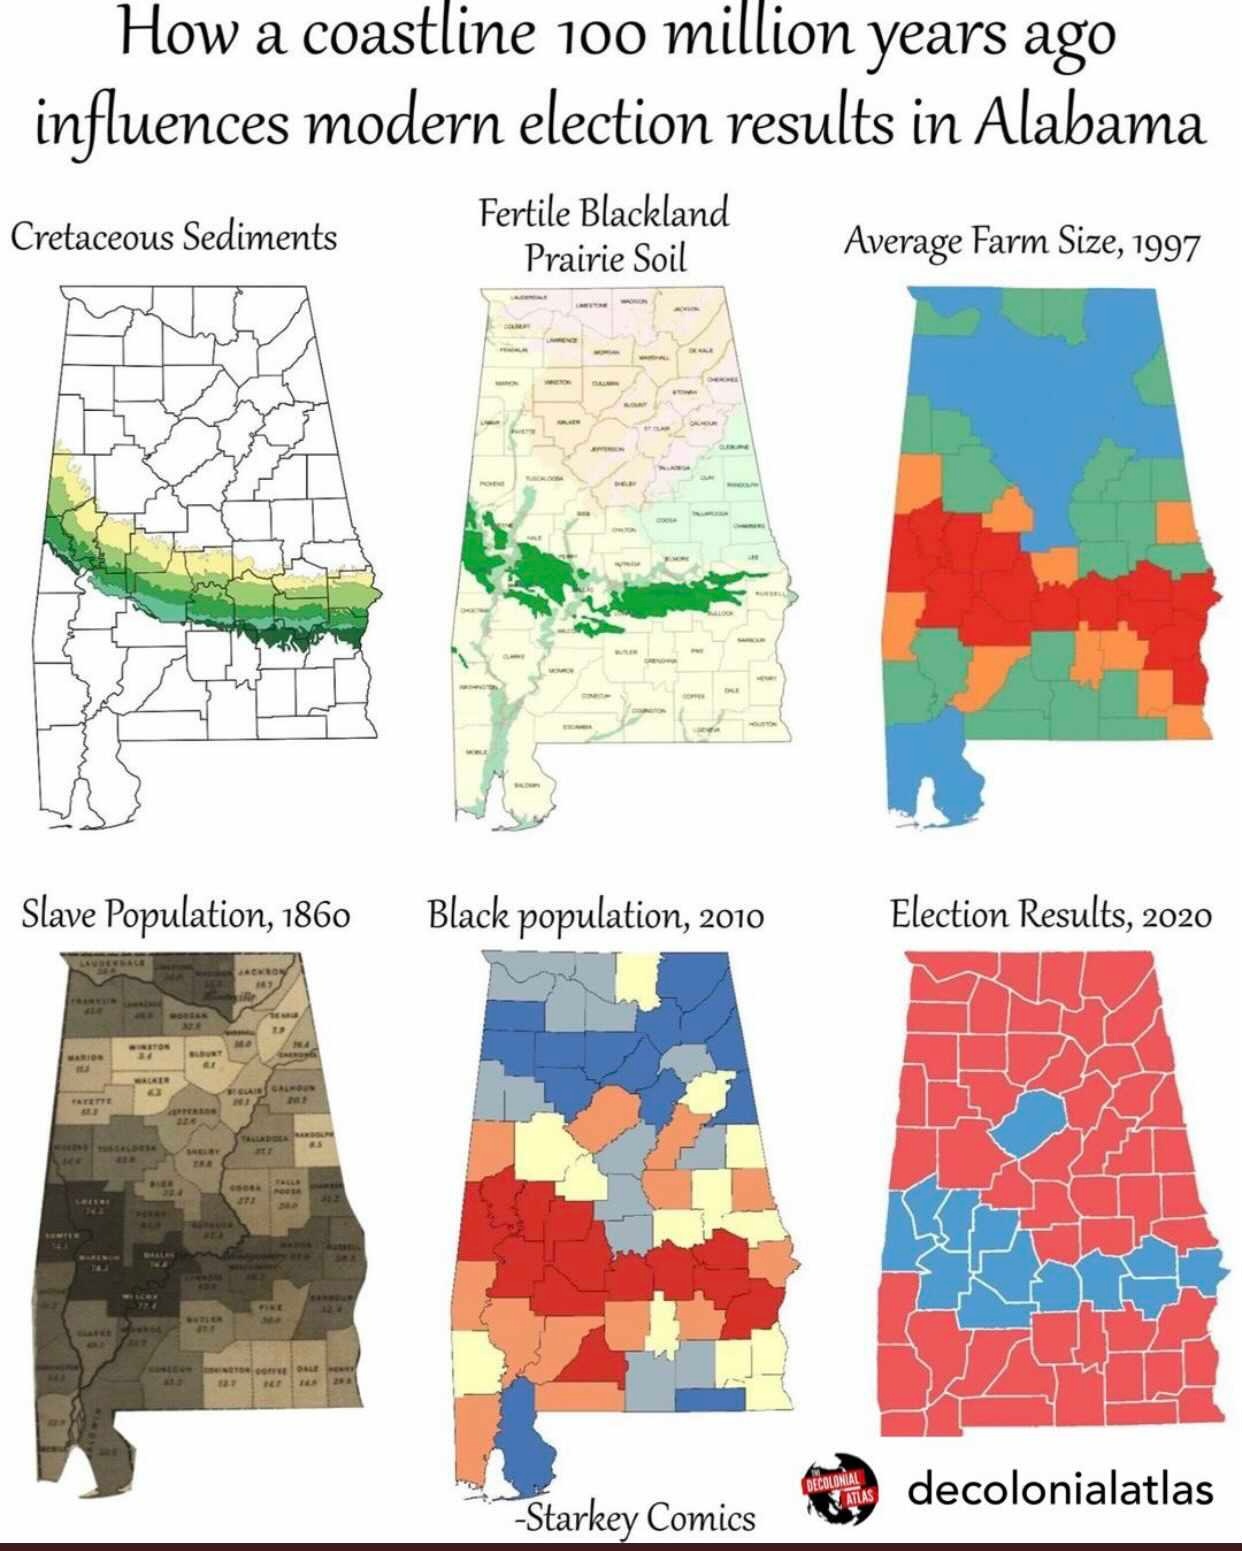
While we don't have to confuse causality with correlation, I will take the causality part on this one.
Beyond that a coastline 100 years ago may influences modern elections in Alabama today, I get stuck on how events history explains much more about our behavior than what we usually think.
Looking at yourself in the past and you probably understand why you are what you are today.
Still, it's much more difficult to get this lens on the outside world and others’ behaviors.
Usually, we get stuck to the event-level understanding of things.
We prefer to think linearly.
Linear relationships are easy to think about: the more the merrier. Linear equations are solvable. You can take linear systems apart and put them together again.
Still, we are living in a nonlinear world.
Nonlinear systems generally cannot be solved and cannot be added together.
That twisted changeability makes nonlinearity hard to calculate, but it also creates rich kinds of behavior that never occur in linear systems.
If the news and school did a better job of putting events into historical context and acknowledge nonlinearity in causes and effects we would have better behavior-level understanding, which is deeper than event-level understanding.
Expected Contents
When graphs are a matter of life and death
Pie charts and scatter plots seem like ordinary tools, but they revolutionized the way we solve problems.

You have probably seen this New Yorker paper in your feeds. Anyway, it's a very good ad for data and data visualization.
Worth the share with non data-literate people.
How to write like Apple

I recently read a book about writing. In fact, several.
One thing I love is how simple short sentences can be powerful.
We don't really learn to write in school. It's the best medium we found to share ideas human to a human in mid/long-term time.
I hope I don't write like Apple, but there is definitely something into short prose.
Some writing resources I loved :
This BCC documentary is WORTH the time (like really).
Several Short Sentences About Writing (one of my favorite books ever).
Great and simple data storytelling
Beyond the subject - tricky in terms of policies and engineering - the article format is simple but pedagogic.
Simple charts and buttons; word definitions here and there.
Soft clustering with Gaussian mixed models

I often fall short when it comes to clustering methods.
K-means works well but it's too basic and results are rarely workable. t-SNE, UMAP, PCA are good but more feature reduction algorithms.
I discovered recently Gaussian Mixed Models.
The good point with GMM is that each observation has now a probability to be in a cluster. Not a hard assessment like in the K-means.
Therefore, we can play with these probabilities. First, it allows to be smoother in the use of clustering results: a 20% vs 70% chance to belongs to one cluster can be really informative depending on the use case.
Also, we can use them as a proxy for embedding. Imagine 3 clusters, one observation has a 10% chance to belongs in cluster A, 40% to be in cluster B, and 50% to be in cluster C. We can use the vector [0.1, 0.4, 0.5] as a numeric definition of our observation and use it for comparison, similarity computing or mix values into gradients.
Life improvements since the 1990s
It can be hard to see the gradual improvement of most goods over time, but I think one way to get a handle on them is to look at their downstream effects: all the small ordinary everyday things which nevertheless depend on obscure innovations and improving cost-performance ratios and gradually dropping costs and new material and… etc. All of these gradually drop the cost, drop the price, improve the quality at the same price, remove irritations or limits not explicitly noticed, or so on. It all adds up.
A list of daily life improvements since the end of the last century.
Always an optimist feeling to remember how we invent new things and optimizing all we can to improve human life.
The Blog Post
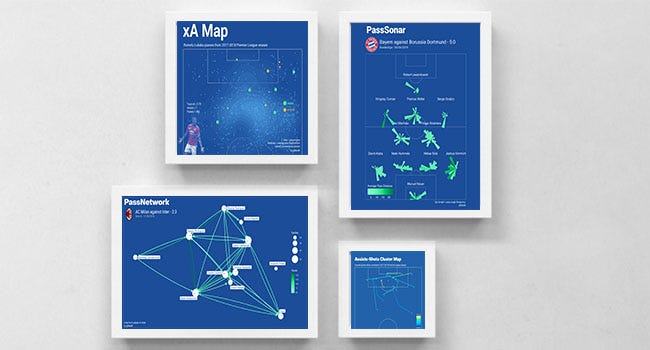
No new blog post this time. Here is an old blog post about football analytics and pass sonars.
PassSonar: Visualizing Player Interactions in Soccer Analytics
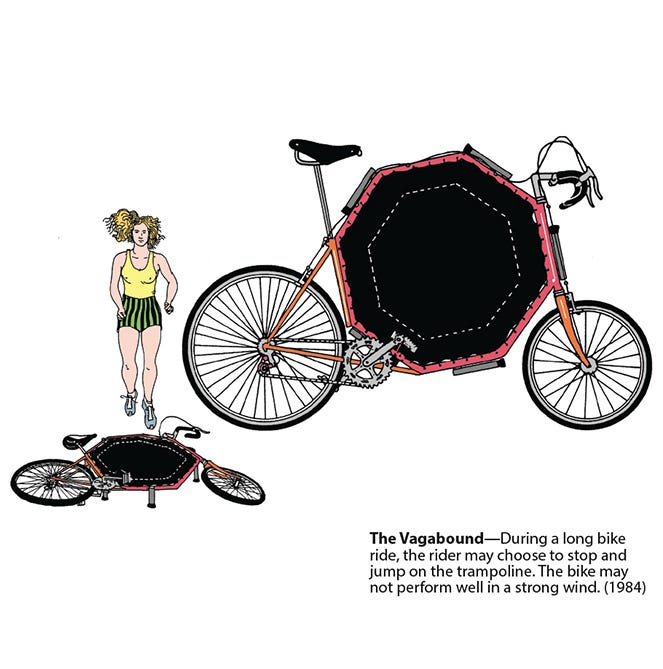
Beyond The Bracket
As engineers, designers, geeks, etc... creators, we often imagine weird solutions before actually finding the correct one.
We often forgot those creepy solutions. We are happy with the correct one, we move toward the next problem.
However, there is something really worthwhile in uncanny solutions. While the whole proposition doesn't answer the problem or it's unrealistic, it has key parts that might be interesting for further projects.
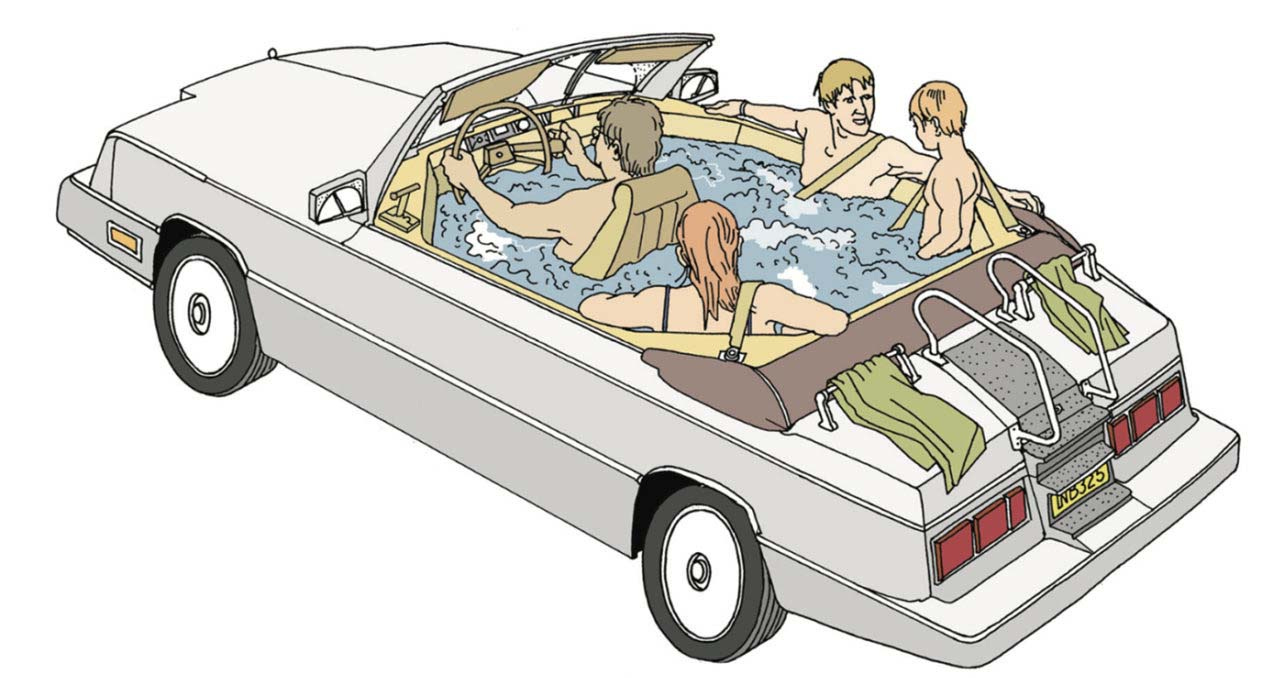
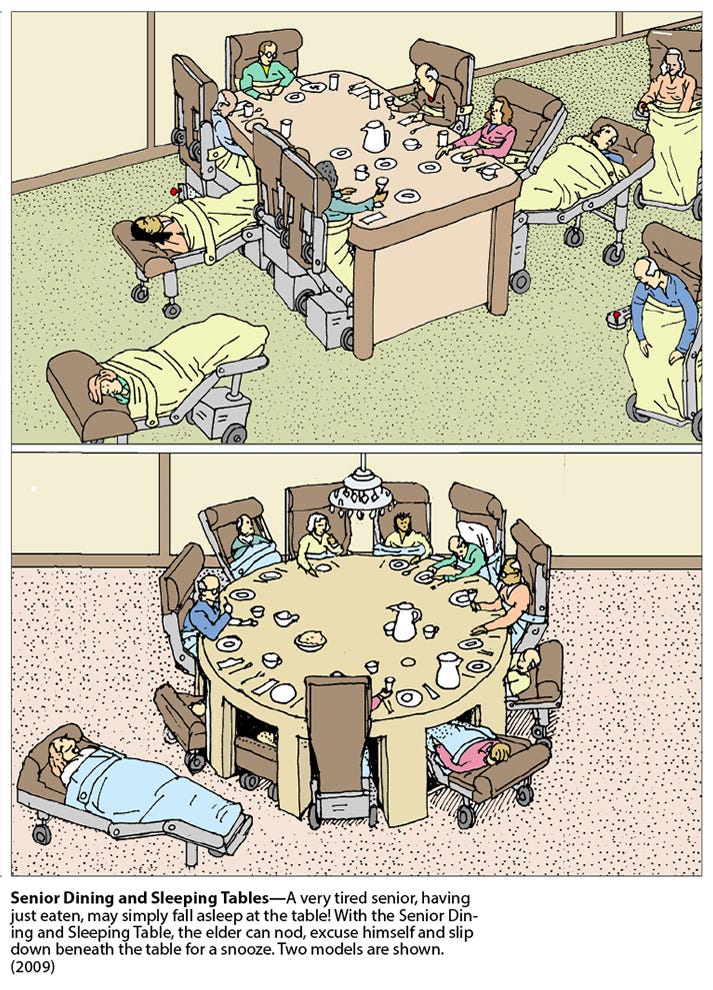
Looking at all these illustrations from Steven M. Johnson highlight this point. Each of its inventions won't come to reality. Anyway, there is always a detail or a key element that titillates our mind - "why it does not exist in real life ?".

There are inertia and delays in engineering problematics and solutions. One solution could seem to be stupid and called genius the next round.
By pushing ideas to their maximum and documenting the process of creation, we don't waste time. Actually, we're winning in the long term.
My posts are not only about data-science stuff. Anyway, contents related to self-development, organization, management are for me much more important than purely technical skills.
New house, new work. Last week I started at Deezer - french Spotify concurrent.
A lot of new information coming in. Many things to play with - new teammates, new visions, new tools.
Plus, the HQ near Montmartre is beautiful with a 360 view of Paris.

Not that much when you see how fast we have moved from VHS to streaming in less than fifty decades.
The average human life condition in Africa in 2000 was like the one in 1970 for European people.