
Issue 8 - The value of code
3D experiment


In a previous experience, my boss and I wondered how much our codebase and analytics work was worth in the company.
How much our legacy can be seen as a financial asset for the company?
After 6 months of work (our team was new) we estimated our work was worth more than 300k dollars.
Presenting this estimation to stakeholders: they didn't blind a second. For them the value in our work was long-term. They didn't care about numbers at the moment.
Engineering work is hard to plan, hard to budget. We face most of the time new problems, with constant tool and technology updates.
Still, we can wonder how much is worth a legacy codebase? How much does it deliver value for the company?
Hard to say, but I believe it can be worth a lot. As we1 automate most of the thing we do - and sometimes others works - our working time is much more capitalized than any other. We deliver straight value in business pipelines.
I sometimes wonder what will look like a modern data-driven company that replaced business operations with engineering backgrounds people. Trying to automate all they can.
📡 Expected Contents
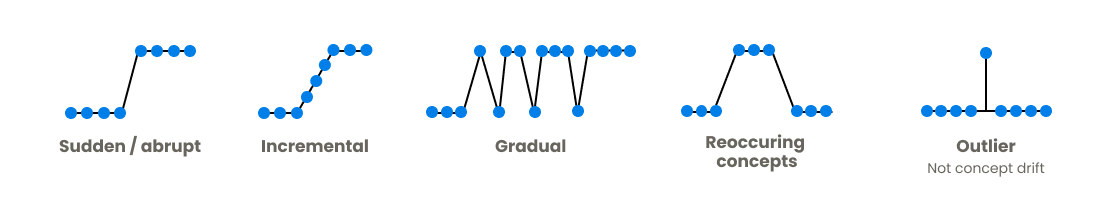
Feature drift
One of my first tasks at Deezer was to understand why one of the fraud models collapsed more and more each month.
Is it because it’s actually working and detecting fraud so it’s more and more difficult to find complex patterns in fraud? Or is it a feature drift in model training?
I’m on the second hypothesis for the moment. Never worked on that kind of problem before: this article summarizes the most common drift concepts.
Do you have some good resources to share or any advice on the subject? Would love to hear from you.
Machine Learning explained
Another great piece of vulgarization from The Pudding. This time it's about modeling wine. This is a well-known sandbox problem in data science. The point here is not to deep dive into complex things but rather to explain modeling to the general public.
Really worth sharing, either for a non-data-literate audience or for aficionados (like you) looking for great storytelling inspirations.

Graphic design has rules, and they work
It’s so often underrated from tech or R&D slideshows. Shape, color, and design make 50% of your content.
Please concentrate the same amount of effort as you do on the actual content.
At least for our eyes!


Analyzing Time Series Data
This collection of stories are fantastic resources to learn and find inspiration to analyze time-series data.
I never used Observable notebooks but they have always shining formatting. Maybe deep dive in Javascript (and D3) one day…

Visualizing Scikit Learn Pipeline
If you use the great Scikit Learn Pipeline feature, you already had some complaints to visualize pipelines. I tried to translate Pipeline Python codes to Draw.io XML format but it was a bit ambitious at the time...
The team behind the most used machine learning library adds the capabilities to visualize these pipelines.
A great tool to add in your documentation or technical slides.

📰 The Blog Post
Rayshader experiment. An experiment I made with the awesome rayshader package. #3Drendering.

🎨 Beyond The Bracket

I recently went to the bowling hall. Beyond the fact that I play four strikes in a row (the first time I succeed in making a streak), I wondered how professional players could make so long streaks.
Pro bowling balls are way cooler than the ones at your local alley.
Engineering is not just only the use of scientific principles to design and build machines. It's about passion, ideas, long-term thinking.
From our computer to the city and finally to bowling alleys. All we touch, we taste, we see, we hear is near or far part of an engineering process.

That's it for this issue!
Working on a review on my football analytics journey, hope I can show up a three pieces series before the New Year.
Going to Stockholm next week, if you have any tips to discover the city you know what you have to do ;)
We: data-scientist, data-engineer, software developer, anyone who tries to avoid repetition in the work he delivers.